

Cumulatively, over those 13 years, the investor ended a full percentage point behind inflation. If one invests in an FD on 1 January, the odds are that over the next 12 months, one will lose money relative to inflation and end up being poorer in real terms.
The bulwark of Indian household savings, real estate, performs only marginally better. Using PropEquity’s house-price data for India’s top seven cities and looking at returns adjusted by the prevailing tax on long-term capital gains, real estate beat inflation in only four of the last 13 years. It does worse than even FDs on a cumulative basis.
What about gold? Considering similar taxation as real estate, gold beats inflation in nine of the past 13 years, but with much greater price fluctuations, including outright losses in some years.
If the judicious investor were to invest a third of her assets in each of these three asset classes, she would still not be able to beat inflation in six of the past 13 years. On a cumulative basis, she would have lagged inflation and thus ended up being poorer in relative terms.
The conclusion of this exercise is straightforward. If one wants to retain purchasing power in India, having some equities in your portfolio seems like a must.
While the exact extent of equity allocation will depend on the investor’s individual circumstances, one can simulate a scenario where our judicious investor invests a fourth of her portfolio in equities.
With 25% each in the other three asset classes, this portfolio’s post-tax return trumps inflation in 11 of the past 13 years, cumulatively beating it by a respectable 1.8% annualized. The years in which this balanced portfolio lags inflation are 2013 and 2015, when there was a large drawdown in gold prices.
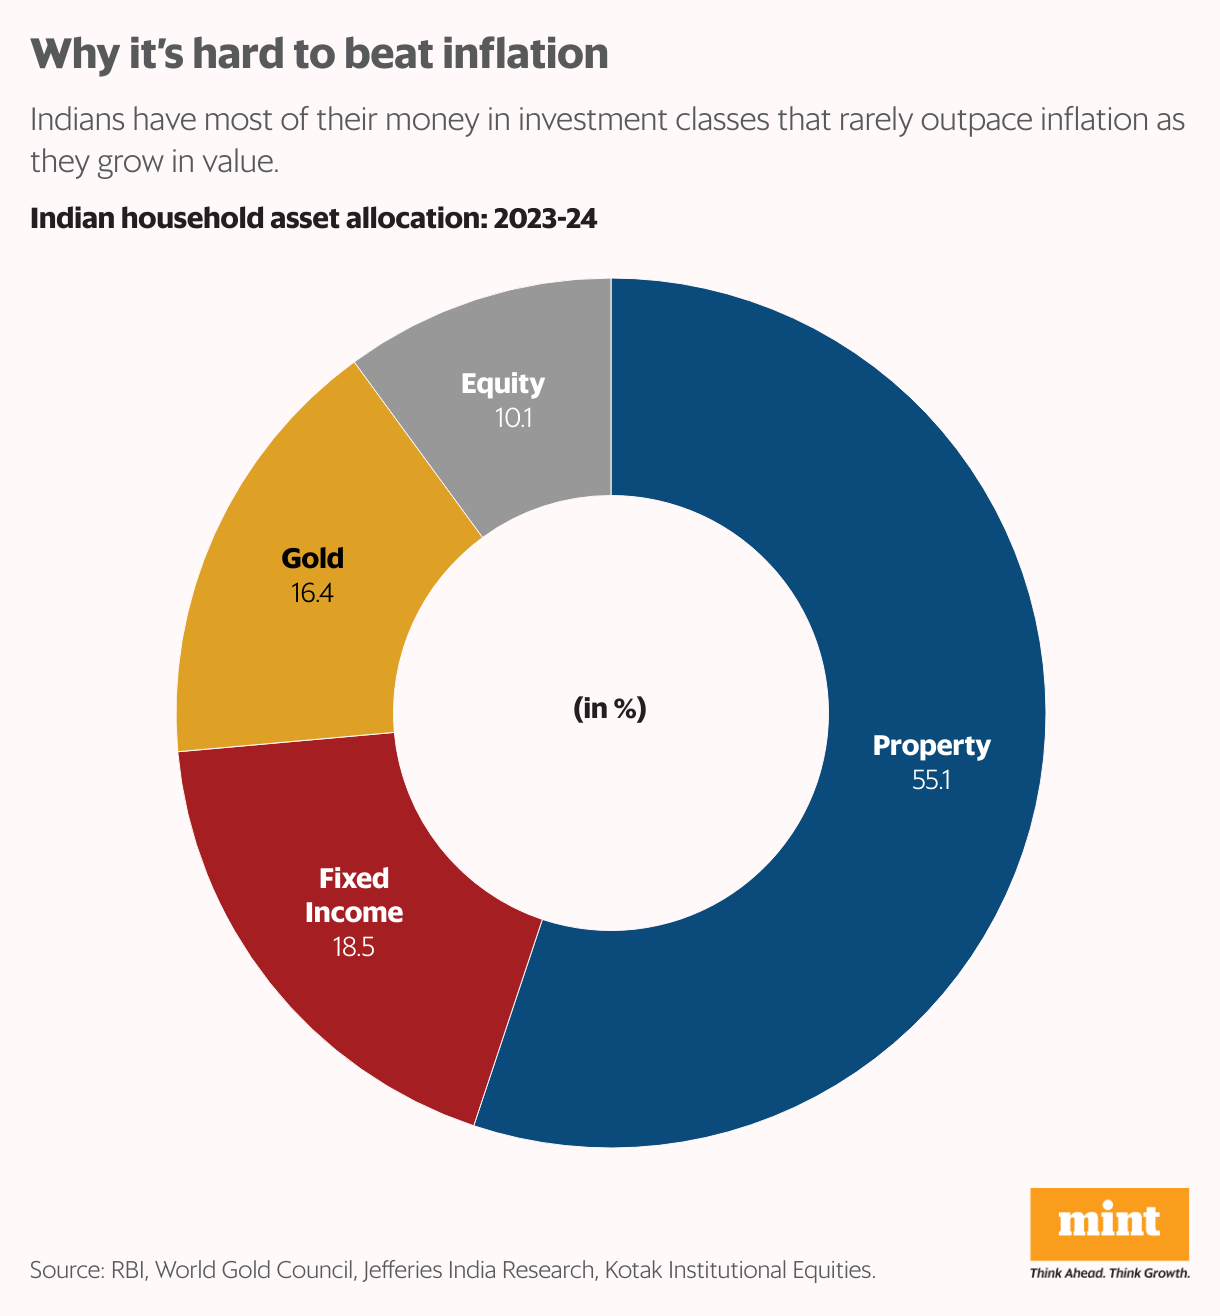
It is instructive to compare this suggested allocation with the actual portfolio of Indian households. While official statistics on the aggregate household balance sheet are hard to come by, using estimates from the Reserve Bank of India, World Gold Council and Jefferies India research, one can piece together the asset side of the household balance sheet (see pie chart).
Note that this is a snapshot of aggregate household savings and not the annual flow of savings into various asset classes. This data does not account for financial liabilities, nor does it include liquid assets held for transactional purposes like cash or current and savings account balances.
Also, equity value classified as promoter holdings is excluded from this exercise as it seeks to construct the investment portfolio of a household.
Given the bleak real returns of most assets except equities, this allocation seems surprising. If one were to compute households’ actual return over the past 13 years, that number would be about 5.7% annualized—barely keeping up with inflation. Even the catching up that households have done has happened only in recent years, thanks primarily to their increasing allocation to equity.
What could have led Indian households, which are generally astute in their financial planning, to allocate their savings in this sub-optimal way? Increased investment in capital markets, thanks to India’s financial inclusion drive, digital public infrastructure and innovative fintech firms, has been a recent phenomenon.
In earlier years, public awareness of—and access to—the entire bouquet of investment options was limited. Another reason could be the way individuals and households mentally account for their savings. Property and gold, which in many cases are ancestral, do not form part of the usual asset allocation arithmetic.
While it is true that many households do not intend to sell these family heirlooms, properly accounting for them is important to estimate the overall allocation correctly. And while one is at it, it is also crucial to include oft-overlooked forced-saving instruments like pension schemes and/or insurance products in the overall math.
Data from Kotak Institutional Equities shows that even within financial assets, almost 40% of household financial assets are invested in pension and insurance products. These products are skewed towards fixed-income instruments and suffer to a large extent from drawbacks similar to those of FDs.
Based on available disclosures from pension and insurance providers, if we bifurcate their assets under management between fixed- income instruments and equities, the overall financial asset allocation of households turns out to be 65% in favour of fixed income and 35% in equities.
Given that financial assets account for a little over a fourth of all household assets, we can infer that equities account for barely 10% of the overall household balance sheet.
The Personal Finance section of Mint occasionally carries an interesting feature that highlights the asset allocation slice-up of financially savvy people, from private bankers and fund managers to wealth advisors. What’s common to these individuals is their large allocation to equities, especially compared to the average household.
If besting inflation over a long span of time is the holy grail of personal finance, the critical first step for every investor would be to draw up a comprehensive inventory of all household assets—discretionary, forced and ancestral.
Chances are it is not going to look anything like a neatly spliced chart of a quarter assigned each to property, gold, equity and fixed-income instruments.
These are the author’s personal views.